Technical chart patterns are visual formations on price charts that traders use to predict future price movements based on historical data. These patterns are formed by price actions and indicate potential trend reversals or continuations.
Triangle Chart Patterns
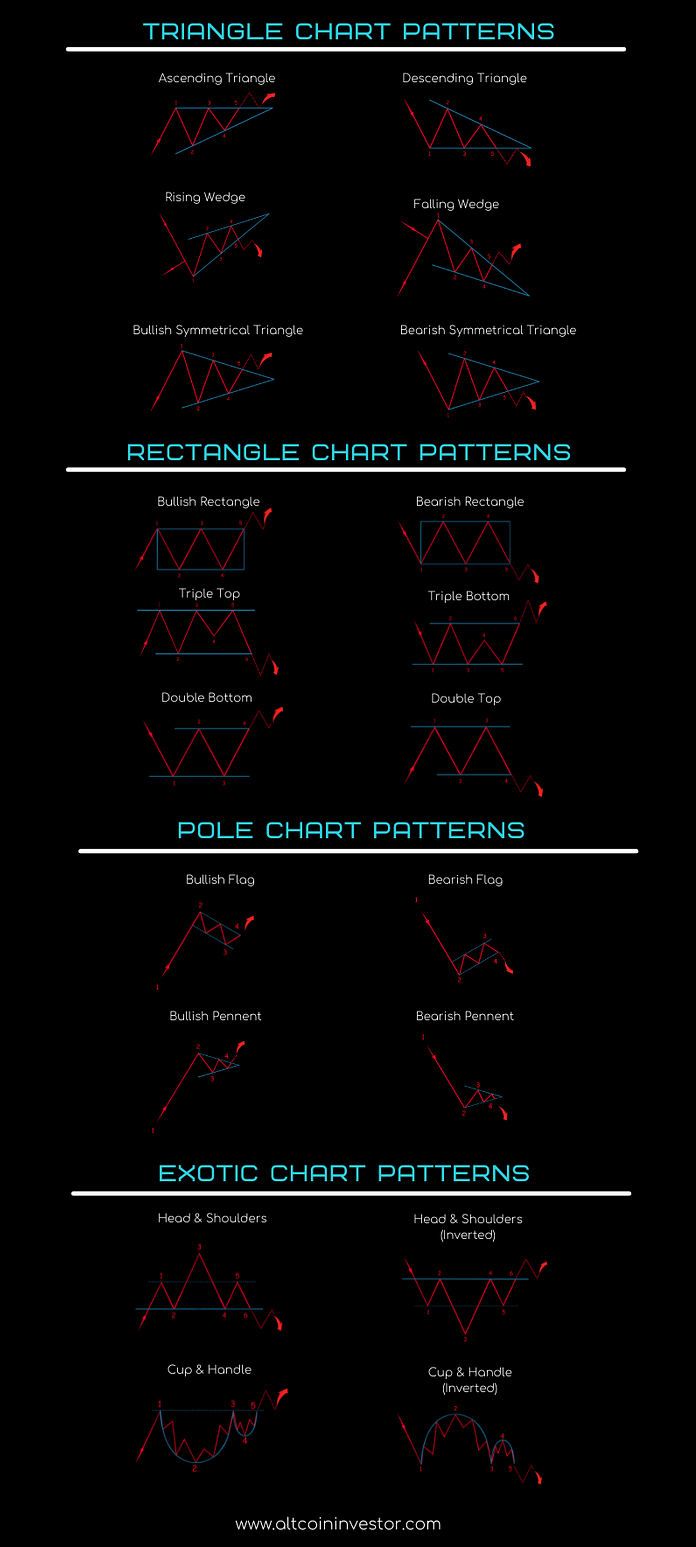
Triangle patterns represent periods of consolidation before the price continues in the original direction or reverses.
Ascending Triangle: A bullish pattern formed by a horizontal resistance line at the top and an upward-sloping support line at the bottom. Indicates buying pressure is increasing and a potential upward breakout.
Descending Triangle: A bearish pattern with a horizontal support line at the bottom and a downward-sloping resistance line at the top. Suggests selling pressure is increasing and a potential downward breakout.
Rising Wedge: Despite its upward movement, this is typically a bearish reversal pattern. It forms with two upward-sloping lines where the support line rises more steeply than the resistance line, creating a narrowing channel.
Falling Wedge: Despite its downward movement, this is typically a bullish reversal pattern. It forms with two downward-sloping lines where the resistance line falls more steeply than the support line.
Bullish Symmetrical Triangle: Shows convergence between support and resistance with equal slopes, suggesting a period of consolidation before continuing the upward trend.
Bearish Symmetrical Triangle: Similar to the bullish version but indicates a potential continuation of a downward trend after the consolidation period.
Rectangle Chart Patterns
Rectangle patterns indicate a trading range where the price bounces between parallel support and resistance levels.
Bullish Rectangle: A continuation pattern in an uptrend where price consolidates between horizontal support and resistance before breaking upward.
Bearish Rectangle: A continuation pattern in a downtrend where price consolidates between horizontal support and resistance before breaking downward.
Triple Top: A bearish reversal pattern showing three peaks at approximately the same price level, indicating resistance and potential downward movement.
Triple Bottom: A bullish reversal pattern showing three troughs at approximately the same price level, indicating support and potential upward movement.
Double Bottom: A bullish reversal pattern resembling a “W” shape, indicating a potential trend reversal from bearish to bullish.
Double Top: A bearish reversal pattern resembling an “M” shape, indicating a potential trend reversal from bullish to bearish.
Flag and Pennant Chart Patterns
These are short-term continuation patterns that form after a strong price movement.
Bullish Flag: A short-term consolidation pattern that appears as a small rectangle tilting against the prevailing uptrend, suggesting a continuation upward after the consolidation.
Bearish Flag: Similar to the bullish flag but forms during a downtrend and suggests continuation downward.
Bullish Pennant: A symmetrical triangle that forms after a strong upward movement, indicating a brief consolidation before continuing the uptrend.
Bearish Pennant: A symmetrical triangle that forms after a strong downward movement, indicating a brief consolidation before continuing the downtrend.
Exotic Chart Patterns
These are more complex patterns that often indicate significant trend reversals.
Head & Shoulders: A bearish reversal pattern consisting of three peaks, with the middle peak (head) being higher than the two surrounding peaks (shoulders). Indicates a potential trend reversal from bullish to bearish.
Inverted Head & Shoulders: A bullish reversal pattern that is the inverse of the traditional head and shoulders. Indicates a potential trend reversal from bearish to bullish.
Cup & Handle: A bullish continuation pattern resembling a tea cup with a handle on the right side. Suggests a brief consolidation before continuing an uptrend.
Inverted Cup & Handle: A bearish continuation pattern that is the inverse of the traditional cup and handle. Suggests a brief consolidation before continuing a downtrend.